
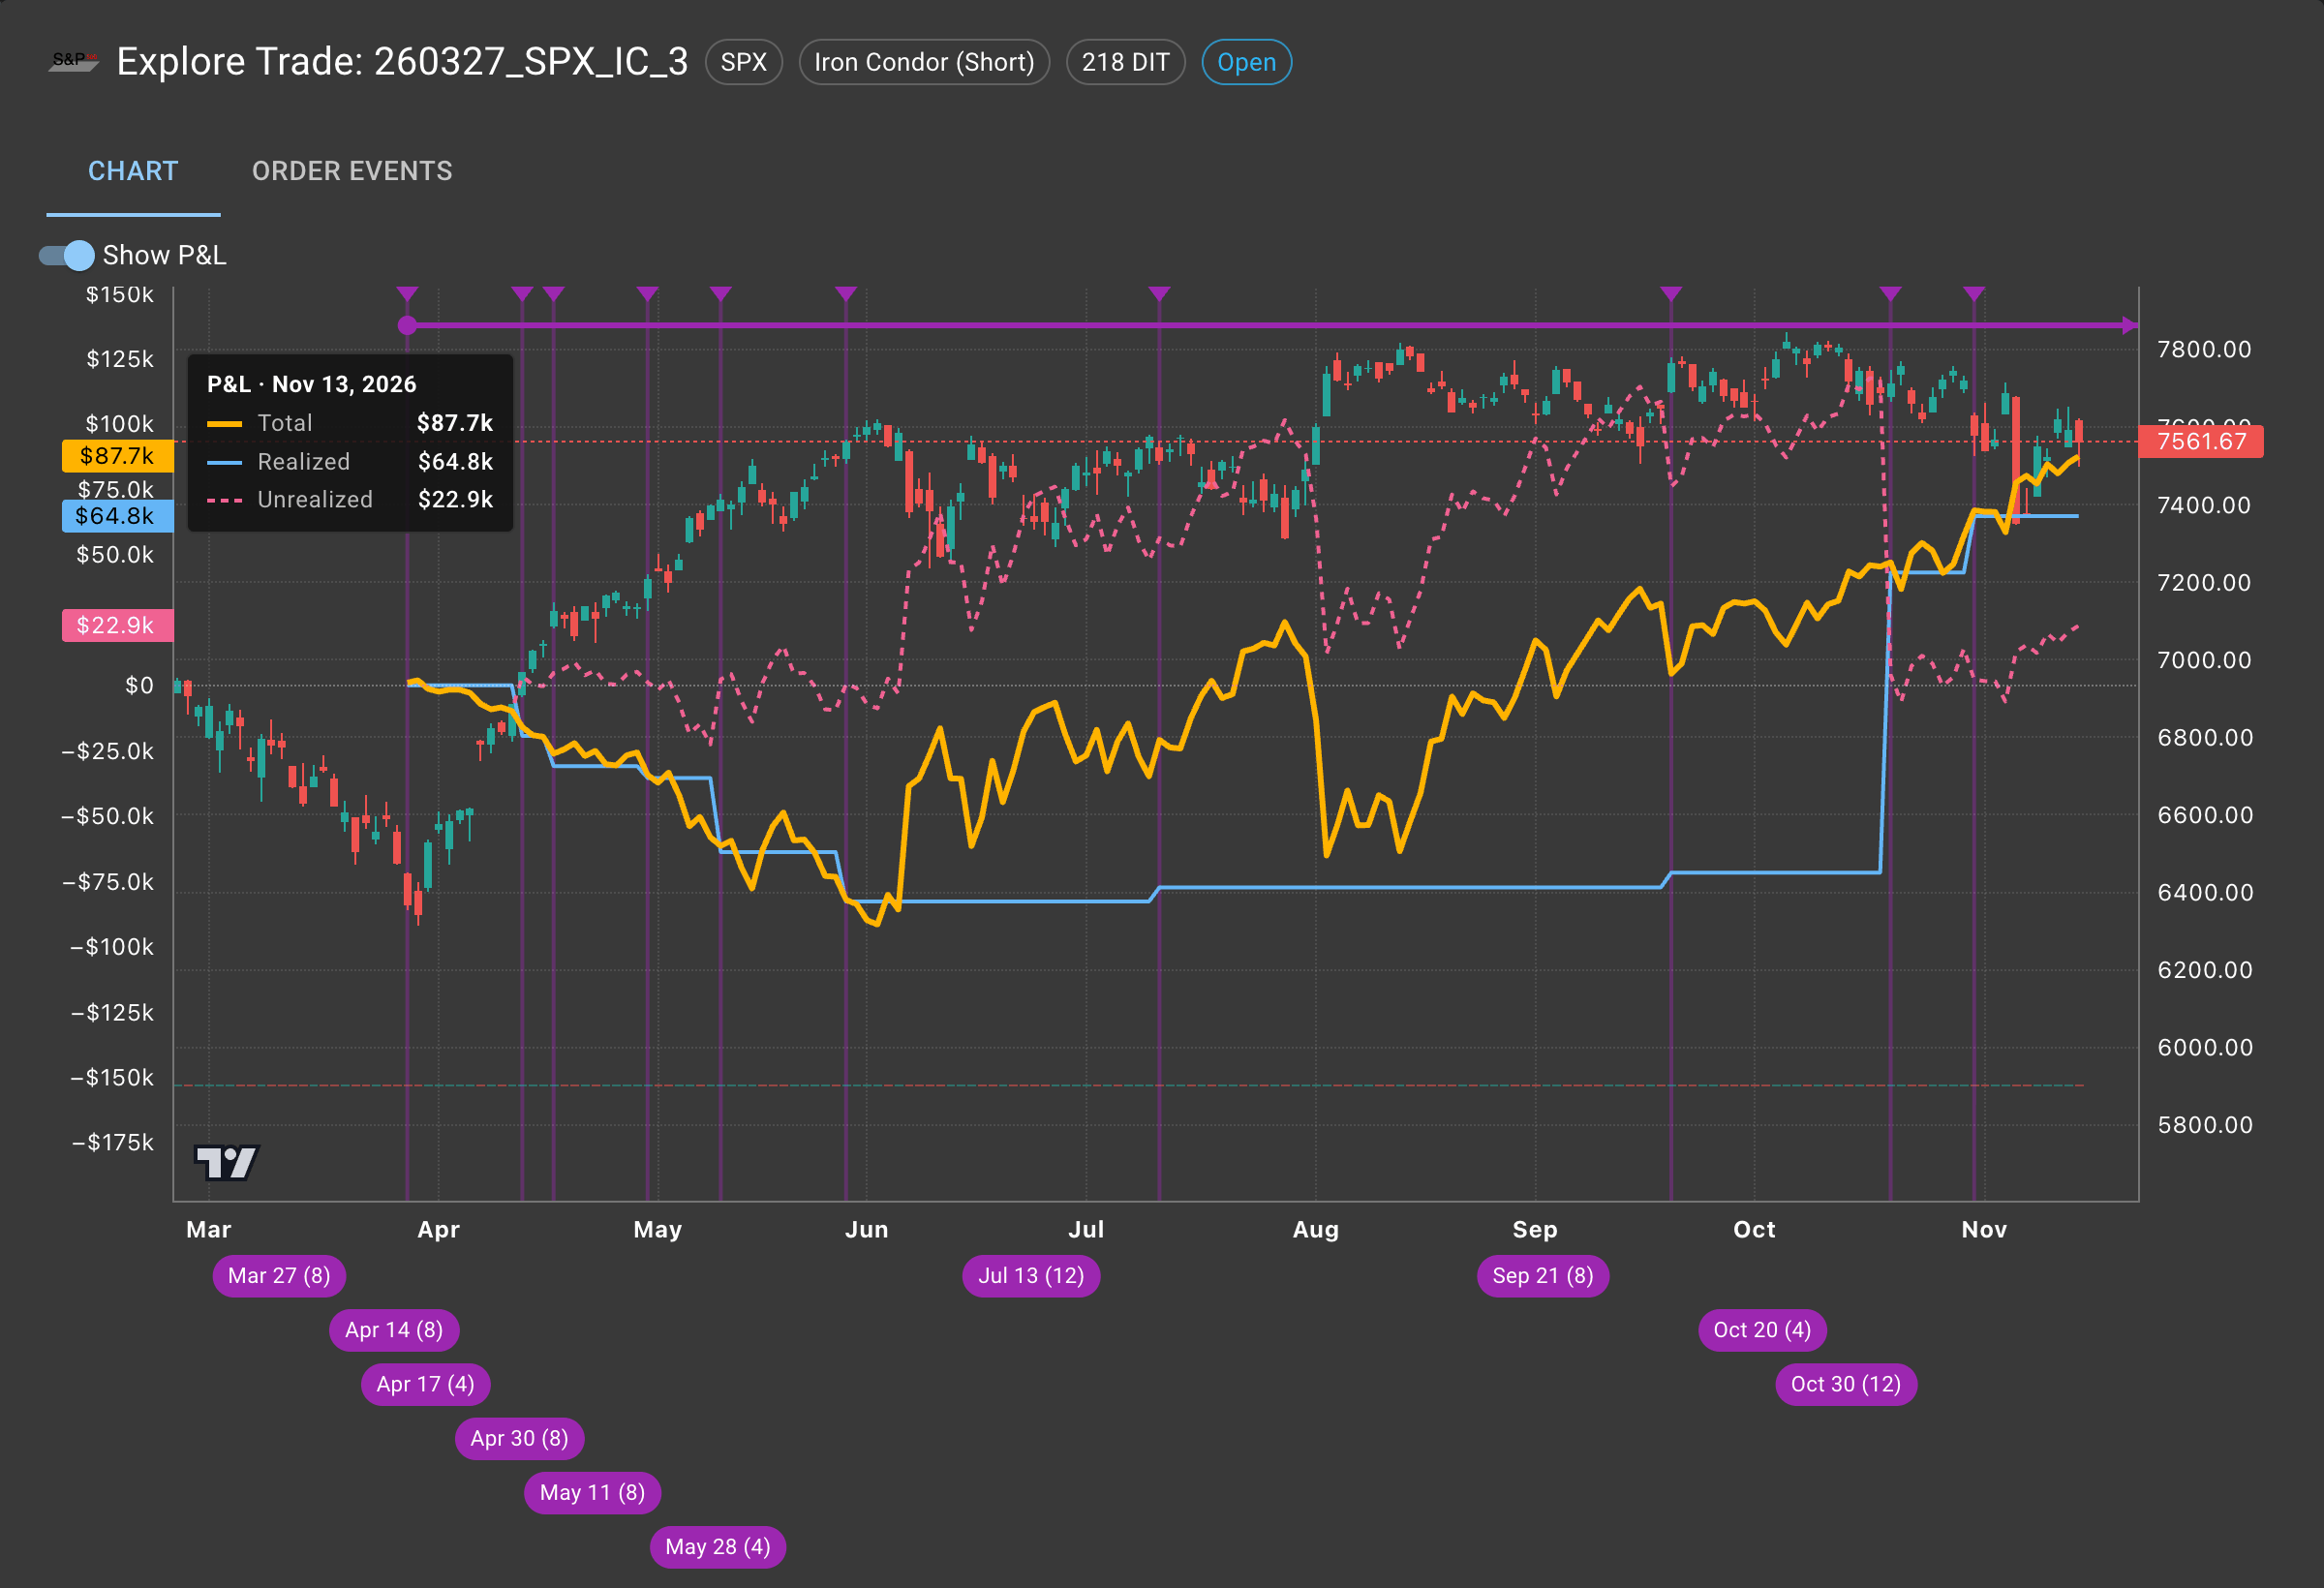
 The Explore Trade view in OptionAgent for one of our iron condors, from our brokerage account connected to OptionAgent: total P&L (yellow), realized (blue) and unrealized (pink dashes) for every day of the trade, over the S&P 500 chart.
Your broker keeps an exact record of every execution: the contract, the quantity, the price, the commission. What it doesn't keep is the trade. When a position is one stock or one option, that's fine. When it's four option legs opened together, rolled one side at a time over eight months, or a wheel that moves from puts to shares to calls, the statement turns into a long list of fills that are hard to put back together. And it only reports the P&L you've realized, which for an adjusted trade can be badly misleading.
This post walks through one of our own trades, an iron condor on the S&P 500 index (SPX), to show why. Every figure and screenshot comes from the OptionAgent software, for our own brokerage account connected to it.
An iron condor in one paragraph
An iron condor is four options on the same index or stock, with the same expiration:
- A put credit spread below the market: sell a put, and buy a cheaper put further below it as protection.
- A call credit spread above the market: sell a call, and buy a cheaper call further above it.
You collect a credit for both spreads up front. If the index stays between the two short strikes until expiration, all four options expire worthless and you keep the credit. If it moves through one side, that spread loses value against you, up to the distance between its strikes minus the credit, and the bought options cap that loss. The trade earns from time passing and from volatility coming down, which is why it's usually opened when volatility is high. And when the market moves toward one side, a trader can roll that side: buy the threatened spread back and sell a new one further away, or further out in time.
What the broker statement shows
Each roll is at least four executions: two to close the old spread, two to open the new one, and a large order is often filled in pieces. On October 30 we rolled the call side of this trade once, in a single order that the broker filled in three pieces, of 11, 14 and 5 contracts. Here is how the monthly statement shows it.
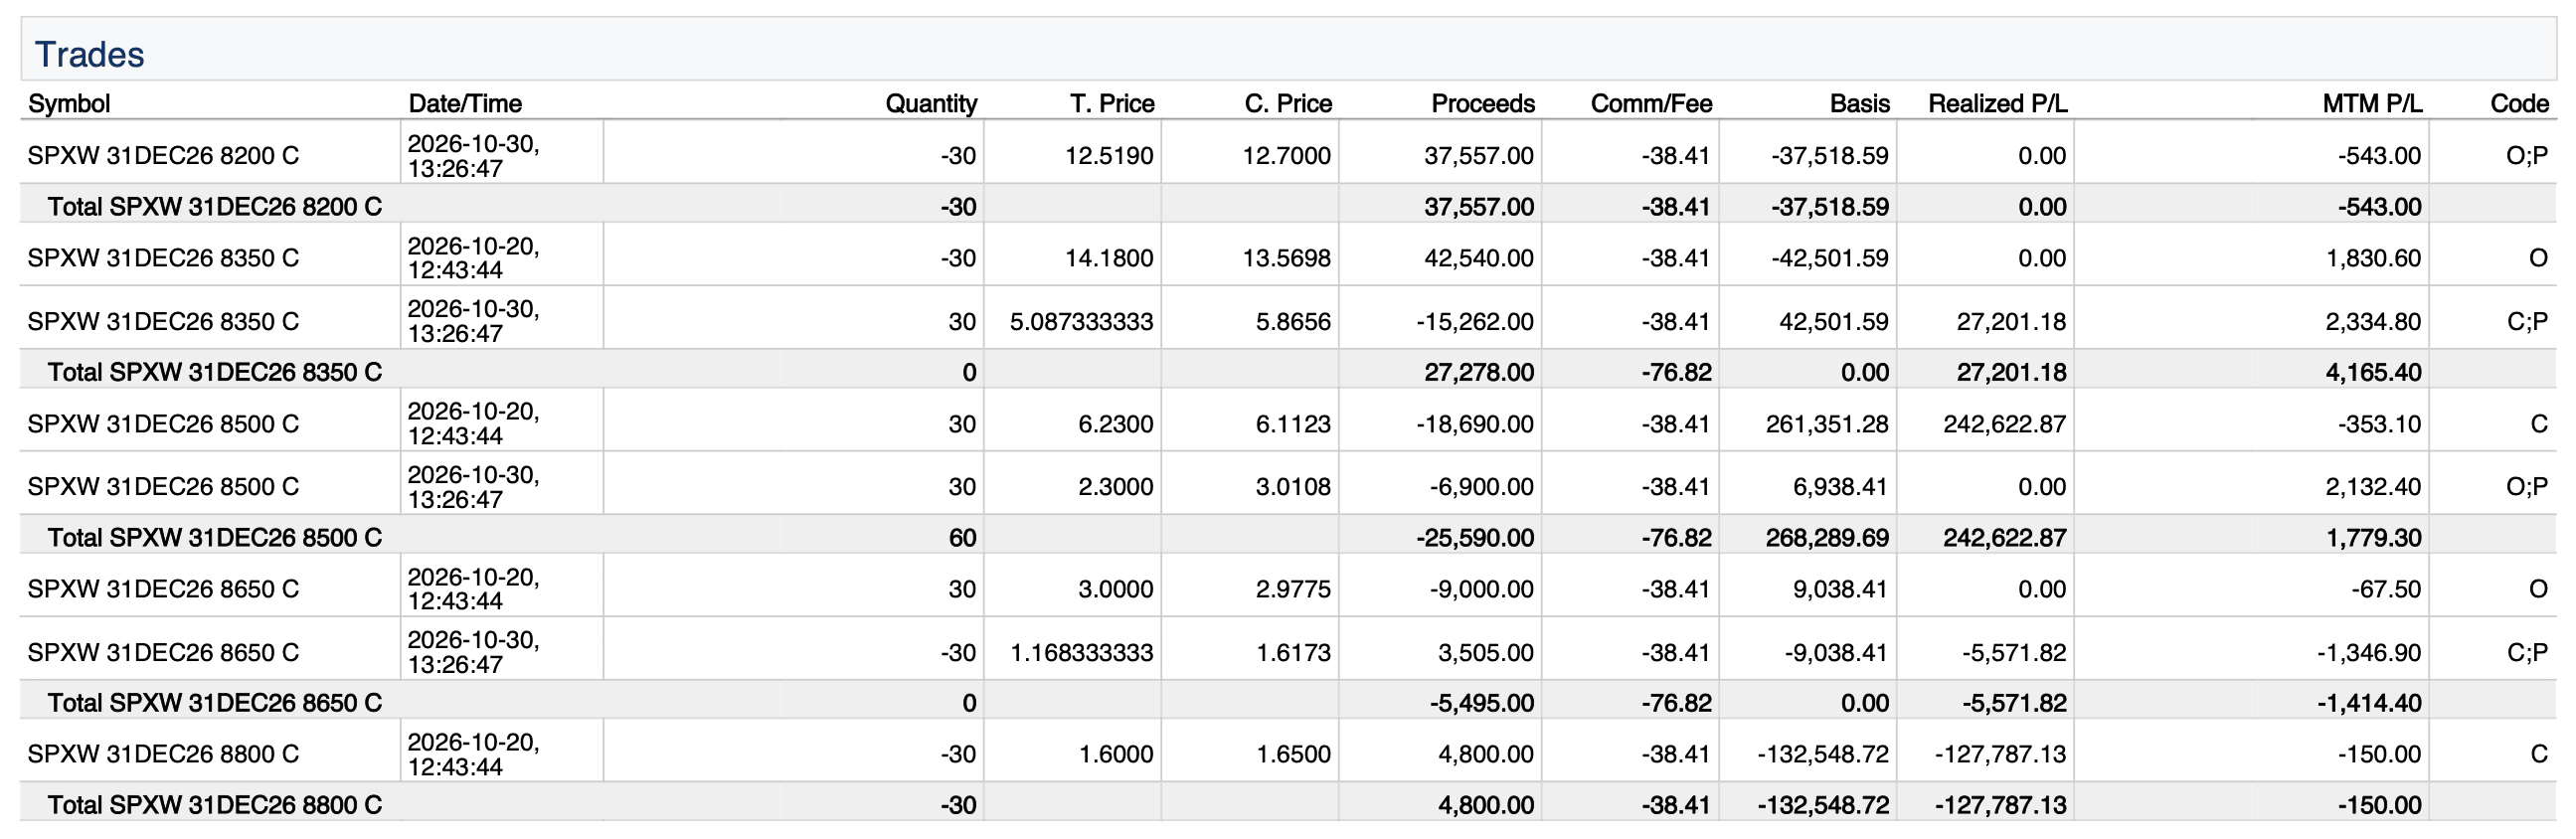 Part of the Trades section of the October 2026 activity statement from Interactive Brokers, for our brokerage account connected to OptionAgent.
The statement sorts by contract, not by order. The four October 30 lines, a sale of the 8200 call, a purchase of the 8350 call and the 8500 call, and a sale of the 8650 call, sit between the October 20 lines of the same strikes, each at an average price such as 5.087333333. The October 20 lines show the same thing from the other side: the 8500 call realized a gain of $242,623 and the 8800 call a loss of $127,787, and they were the two legs of one spread.
Nothing on those lines says that they belong together, that they are one adjustment of a position opened seven months earlier, or that the position is an iron condor at all. Over the life of this trade there are 76 executions across 23 different contracts, spread over ten days. Some days close one expiration and open another; one day (April 30) closes the August puts, closes the October calls, and opens new December calls and puts, all in one order. Reconstructing the trade from that means matching every closing line to the line that opened it, by hand.
The wheel has the same problem
In our post on the wheel we showed the combined P&L of each complete wheel: puts sold, shares assigned, covered calls sold on them, and the shares called away. On a statement, those are separate sections. The puts are in options, the assignment shows up as a stock purchase at the strike price, the covered calls are back in options, and the call assignment is a stock sale. Each piece has its own lines and its own realized P&L, and nowhere does the statement add them up for the whole wheel. Only by keeping them together do you see what the wheel did as a whole.
One iron condor, from a $91,500 loss to an $87,700 gain
March 27: the open. The S&P 500 closed at 6,369 that day, almost 9% below its high, and the VIX closed at 31, its highest close of the spring. We sold an iron condor on the S&P 500 index (SPX options): 30 contracts expiring August 21, with the short strikes at about 16 delta on each side: a 5450/5425 put spread and a 7200/7225 call spread, for a $24,000 credit. The next trading day turned out to be the low of the year.
April and May: the rally, and the losing rolls. From that low the S&P 500 climbed more than 19% in two months. Each time it approached the short calls we rolled the call side up and out: on April 14, April 17, April 30 and May 11, and once more on May 28, when it was above 7,500. Each roll bought back a call spread that had gone against us and sold a new one further away, and each locked in a loss. By May 28 the trade had realized $82,700 of losses. On June 2 the total, realized plus the open spreads, was at its low: −$91,500.
June to September: time on our side. The market leveled off below the new short calls, and the far-dated spreads started losing value, which for the seller is a gain. On July 13 and September 21 we rolled the put side up, closer to the market, for more credit.
October: taking the gains. By mid-October the call spread we had sold on May 28 for $42.96 was worth less than $5. On October 20 we bought it back and sold a new one closer to the market, and on October 30 we did the same again.
Today. At the November 13 close the trade is up $87,700: $64,800 realized and $22,900 still in the open spreads, with seven weeks to the December 31 expiration.
What's still left in the trade. The two open spreads, a 6700/6650 put spread and an 8200/8500 call spread, were sold for $37,100 between them, and would have cost $14,200 to buy back at that close. The difference, $22,900, is the unrealized gain above. The $14,200 is what's still left in the trade: if the S&P 500 stays between 6,700 and 8,200 until December 31, both spreads expire worthless and that becomes profit too, for a final gain of $101,900. Of that, 86% is already in hand. A broker statement shows neither number: not the $22,900 the open spreads have already made, nor the $14,200 they could still make.
And what's at risk. The other side matters just as much. The bought options cap the loss, but the call spread is 300 points wide: if the S&P 500 closed above 8,500 on December 31, about 12% higher in seven weeks, it would lose $900,000, turning the trade into a loss of about $798,000. Below 6,650, the put spread would lose $150,000, for a loss of about $48,000. OptionAgent makes that risk easy to watch and to limit. Alerts are set per strategy, not per trade: for our iron condors, an alert fires when either short option's delta, roughly the market's estimate of the chance it finishes in the money, climbs past the level where we want to act. Others tell us when a side has lost so much value that it's worth rolling closer, as on October 20 and 30, and when the trade gets close to expiration. You set it once on the Iron Condor (Short) strategy, and every trade assigned to that strategy is watched from the moment it's assigned, this one included, without setting anything up trade by trade. And when you'd rather have the exit in place than an alert, a trade's New order dialog on the Positions page places a stop or stop-limit order that closes the whole trade, with a slider to set the most you're willing to lose.
Realized P&L jumps, and the trade doesn't
A broker statement reports realized P&L: what you lock in when you close something. It doesn't value what's still open. For a trade you adjust, that's misleading in both directions.
 The P&L legend of the Explore Trade view on four days of this trade: the low on June 2, the days before and after the October 20 roll, and November 13.
Look at October 19 and 20. Realized P&L went from −$71,700 to +$43,200 in one day, a jump of almost $115,000. Had you looked only at the statement, you'd think the trade made $115,000 that day. It made $1,600. The gain had built up over the summer in the open spreads, as unrealized P&L of $117,000, and the roll simply moved it from one column to the other. The same thing happened in reverse in the spring: each losing roll showed up as a sudden realized loss, while most of the damage had already happened as the market rose.
The total P&L is the line that tells you how the trade is doing, and it needs a value for every open contract on every day. That isn't on any statement. In the chart at the top it's the yellow line; the blue line, realized P&L, moves in steps on the roll days and says little about the trade in between.
How OptionAgent builds the trade
Import. OptionAgent imports your executions from your broker automatically, every 5 minutes during the trading day, from Interactive Brokers and TastyTrade. A file you download from your broker can be uploaded too.
Group into trades. Suggest Trade Groupings puts executions that belong together into one trade. It recognized the four legs opened together on March 27 as an iron condor and proposed the trade with that strategy. It then followed every adjustment: each roll closes legs that the trade holds and opens their replacements, so all 76 executions, across 23 contracts, land in this one trade. For a wheel, OptionAgent keeps each stock's puts, shares and covered calls together, and the Wheel vs Stock page shows their combined result.
Write the notes. OptionAgent writes a note for the trade's orders as they happen: what was adjusted, from which strikes to which, at what credit or debit, and the market at the time. The trade's notes read as a journal of the whole trade, without typing a word.
 The bottom of the Explore Trade view: the four executions of the October 30 roll, and the trade notes OptionAgent wrote for October 30 and October 20.
Explore it. The Explore Trade view, in the screenshots above, puts the whole trade on one chart: every day with fills marked, and the realized, unrealized and total P&L for every day from the first fill to today. Hover over any day to read its three values. Open contracts are valued at that day's closing prices.
Follow it live. The Positions page shows the same split for every open trade, kept up to date in real time with live prices while the market is open. Filtered to this trade, it shows the total P&L, the realized part and the unrealized part, under the strategy the trade belongs to. The green bell next to the trade's name means the strategy's alerts are watching it, and none has fired.
 The Positions page in OptionAgent, filtered to this trade, on November 13 at the close: total P&L (T.PnL), realized (R.PnL) and unrealized (U.PnL), updating with live prices. The realized figure here follows the broker's first-in, first-out matching, so it can differ slightly from the Explore Trade view, which uses each contract's average cost.
Tracking each strategy
Every trade is also assigned a strategy: this one is an Iron Condor (Short). The Stats page then adds up every trade per strategy: how many trades, how many won, the P&L, the average per trade and the average time in the trade. Strategies can also be combined into groups, for example all the premium-selling strategies together. That shows you which of the strategies you follow are actually working, which no broker statement can tell you, because it doesn't know what strategy a trade was. More on what OptionAgent keeps for every trade is on the Journal page.
The figures are from one OptionAgent trading account, for one trade opened on March 27, 2026 and still open at the November 13 close; open contracts are valued at that day's closing prices. They describe what happened, not what will happen.